

This illustration shows how magma may have travelled towards the seafloor and heated the sediments, causing vast amounts of greenhouse gases to form. Illustration: VBER
In our last article we saw the Greenland mantle plume’s impact on the oceanography of the North Atlantic. Now let’s look at its effect on climate.
Paleocene-Early Eocene greenhouse and hyperthermals
The Late Cretaceous greenhouse climate continued into the Paleocene despite the Yucatán bolide impact that devastated the Earth’s fauna and flora 66 million years ago (Ma).
The Paleocene was punctuated by a series of hyperthermal (HT) events when increased air and sea-surface temperatures enabled the temporary migration of warm-water dinoflagellates from the Tethys into higher latitudes.
The earliest HT (WD1) resulted from the Yucatán bolide impact and followed cooling that lasted ‘several decades at most’ when solar radiation was reduced by dust and sulphur aerosols ejected by the impact (Vellekoop et al. 2014).
Increased levels of the greenhouse gas carbon dioxide (CO2) from vaporised carbonate rocks then raised air and sea-surface temperatures for about 100,000 years (Coccioni et al. 2010), enabling the dinoflagellates Manumiella and Trithyrodinium to migrate into higher latitudes (Figure 1). This corresponds to the Dan-C2 global HT listed in Arreguín-Rodríguez et al. (2021).
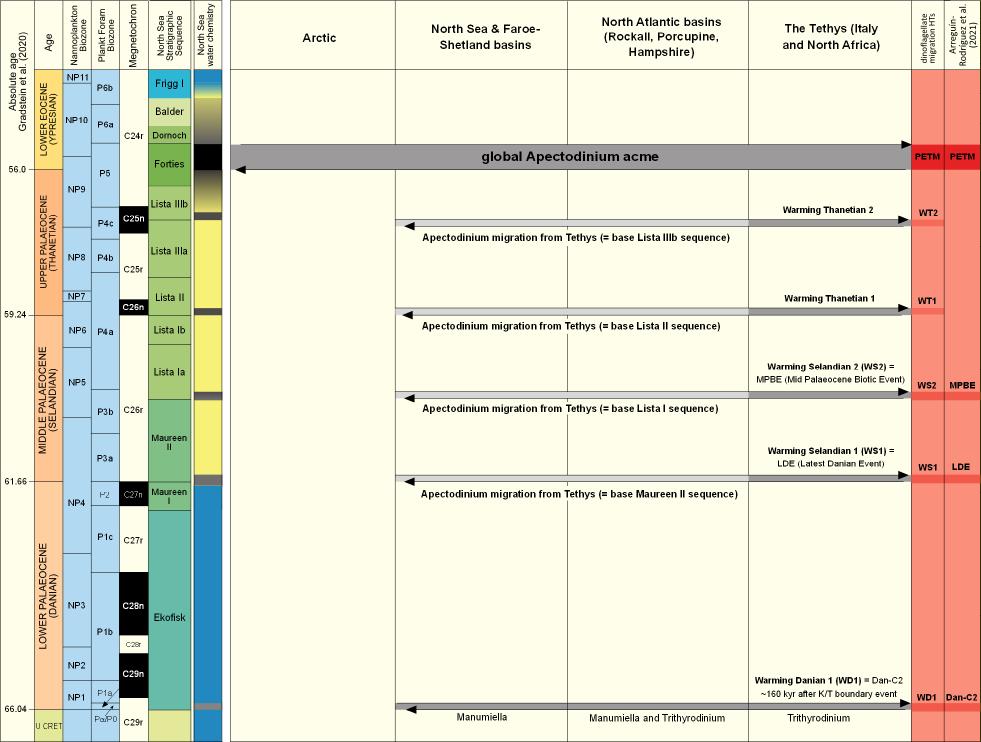
WD1 was followed by four Middle to Late Paleocene (Selandian-Thanetian) HTs when the warm-water dinoflagellate Apectodinium migrated from the Tethys into mid-latitudes, and the earliest Eocene PETM when its global migration included the Arctic. All of these ‘dinoflagellate migration HTs’ correspond to North Sea / Faroe-Shetland sequence boundaries and four equate with global HTs listed by Arreguín-Rodríguez et al. (2021) (Figure 1).
The five HTs occurred during uplift of the Greenland mantle plume and development of the North Atlantic Igneous Province (NAIP) which extruded between six and ten million cubic kilometres of magma, mostly as flood basalts.
CO2 emitted during volcanic eruptions and vented underground magma would have raised air and sea-surface temperatures that were then increased by methane (CH4) released from sub-sea methane hydrates (clathrates), resulting in the succession of HT events.
The largest of these, the PETM, was previously placed in the Late Paleocene, but re-assignment of the P-E boundary at the base of the PETM now places it in the earliest Eocene (see Gradstein et al. 2020).
Paleocene-Eocene Thermal Maximum (PETM)
The PETM is significant today because it indicates how the climate may change in the near future due to anthropogenic emissions of greenhouse gases:
‘The Paleocene-Eocene Thermal Maximum (PETM) at 56 million years before present is arguably the best ancient analog of modern climate change. The PETM involved more than 5oC of warming in 15-20 thousand years (actually a little slower than rates of warming over the last 50 years), fueled by the input of more than 2000 gigatons (a gigaton is a billion tons!) of carbon into the atmosphere… As a consequence, surface ocean temperatures at the peak of the event were extremely warm, especially in the high latitudes. Off the coast of Antarctica, a location today that is close to freezing, the oceans were about 20oC (68oF) at the peak of the PETM!… Temperatures off the coast of West Africa were 36oC which is 97oF.’ (Penn State University 2023).
The PETM began 56 million years ago and lasted for approximately 170,000 years, with data from a coeval hydrothermal vent beneath the Norwegian-Greenland Sea providing a detailed record of events that occurred at that time. These include a large and rapid initial pulse of CH4 release followed by up to 12 more pulses.
Frieling et al. (2016) calculated that 1,500 billion tonnes of carbon were released from submarine vents during the PETM, concluding that ‘CH4 from the Norwegian Sea vent complexes was likely the main source of carbon during the PETM’.
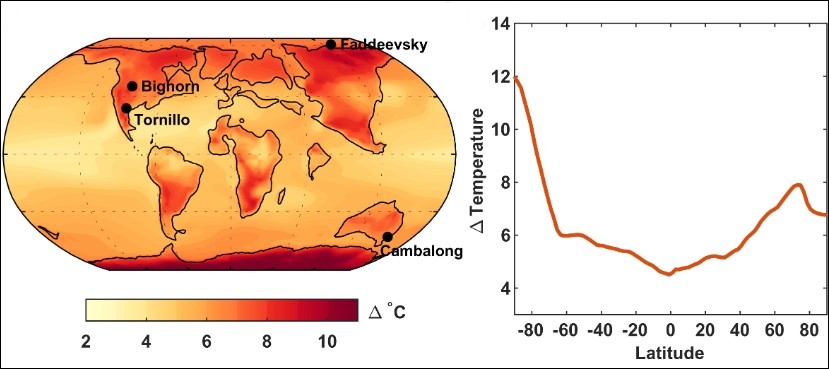
Global warming was not uniform during the PETM. Land areas warmed more than oceans, and polar regions (60-90oN) warmed by 8oC compared to low latitudes (30oS to 30oN) that warmed by 5oC (Tierney et al. 2022). Warming was particularly marked in Antarctica and increased by 12oC in the interior of the continent which had no ice cover at that time (Figure 2).
This gives us an insight into the possible future effect of today’s climate change if atmospheric CO2 continues to increase, triggering the release of methane from Arctic and sub-Arctic permafrost and submarine sediments.
Today’s methane release
Methane is a potent greenhouse gas that is mostly oxidised in the atmosphere to CO2 and water within 8 to 12 years, but it can remain in the stratosphere for about 120 years. On a 100-year timescale it has 28 times greater Global Warming Potential (GWP) than CO2 and is 84 times greater on a 20-year timescale (European Commission 2023). (GWP is a measure of how much infrared thermal radiation a greenhouse gas will absorb relative to CO2.)
This is concerning because today’s warming has resulted from anthropogenic emissions of CO2 (76%), methane (16% mainly from rice paddies and ruminants) and nitrous oxide (6%), but the amount of methane may soon increase, as it did during the PETM.
‘Scientists estimate that five times as much carbon might be stored in frozen Arctic soils as have been emitted by all human activities since 1850’ (Voland 2016).
Like the PETM, today’s initial trigger is increased atmospheric CO2, but high Arctic and sub-Arctic temperatures are now melting permafrost and releasing methane from shallow clathrates (Figure 3).
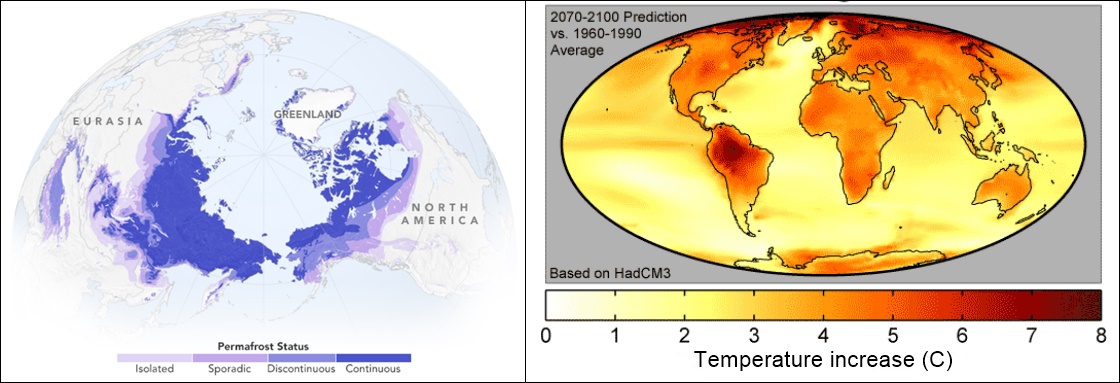
On 29 May 2020, melting permafrost resulted in the worst oil spill in Russia’s Arctic history as a fuel tank collapsed, emptying more than 20,000 tons of diesel fuel into the Ambarnaya River. Three weeks later, on Sunday 21 June, temperatures in the northeast Russian town of Verkhoyansk reached 38°C (100.4°F), the highest ever recorded north of the Arctic Circle, with Alaska and northern Canada also having anomalously high temperatures in regions of extensive permafrost (Figure 3) (from ‘The Azolla Story’, Bujak & Bujak 2020).
Wildfires had ravaged large areas of Siberia, Alaska, Greenland and Canada in 2019 and continued into 2020, as ‘zombie fires’ spread from peat that had smoldered during the winter, releasing an estimated 100 megatons of CO2 between 1 June and 21 July and thawing more permafrost which continued into 2021.
‘For the second year in a row (2021], NOAA scientists observed a record annual increase in atmospheric levels of methane’ to 1,895 ppb, 162% greater than pre-industrial levels, and this will increase as more permafrost melts and sub-sea clathrates are released due to ocean warming (Amos 2019).
There is therefore imminent danger that a positive CO2-CH4-CO2 feedback loop may result in a climatic tipping point beyond which we will not be able to control the increase in atmospheric greenhouse gases, global temperatures, extreme weather events and sea-level rise as Antarctic and Greenland continental ice melts. And this is occurring as our population increases by a million every three days.
From greenhouse to icehouse
The PETM was followed by the Early Eocene Climatic Optimum (EECO) and at least two more Early Eocene HTs: Eocene Thermal Maximum 2 (ETM2, aka ELMO) and H2 which, like the earlier HTs, ‘can provide insight into a future, warmer world’ (Rush et al. 2023).
The Early Eocene and its greenhouse climate lasted for approximately eight million years, followed by the Arctic Azolla Event (49.3-48.1Ma) which reduced atmospheric CO2 by at least 195 ppm based on calculations of azolla’s Arctic Ocean biomass during the event (Bujak & Bujak 2020, Speelman et al. 2009), similar to values indicated by CO2 proxies (Rae et al. 2021).
Subsequent oceanic and tectonic processes reduced atmospheric CO2, with brief periods of CO2 increase and warming in the Middle Miocene and Pliocene. Antarctic and Arctic glaciation began approximately 33.7 and 2.6 million years ago (Pagani et al. 2011) leading to today’s bipolar icehouse world. The pre-industrial value of 280 ppm has now increased to 417 ppm, the highest since the Pliocene when there was no Arctic Ocean ice.
The question we face today is this: will levels of CO2 increase in the near future to those of the Eocene, moving the climate back to full greenhouse? Only time will tell – that of the geological past and our possible future.
DR JONATHAN BUJAK
Dr Jonathan Bujak was a research scientist with the Geological Survey of Canada in the 1970s and early 1980s, publishing the definitive biostratigraphic zonal schemes and stratigraphy of more than 100 key wells in offshore eastern Canada with Graham Williams.
He then worked with Petro-Canada International Aid Corporation (PCIAC), training geologists in Colombia, Jamaica and Venezuela, and leading paleontological expeditions into the interior of South America, before founding Bujak Research International in 1985.
Jonathan returned to the UK in 1990 and published the bio- litho- and sequence stratigraphy of the North Sea and Faroe-Shetland Basin with David Mudge who sadly passed away in 2020.
Jonathan was involved with the only two geological expeditions to the North Pole: the Lomonosov Ridge Experiment (LOREX) in 1979 and the Arctic Coring Expedition (ACEX) that discovered the Arctic Azolla Event in 2004, through his collaboration with Henk Brinkhuis and colleagues at Utrecht University’s Department of Marine Palynology and Paleoecology.
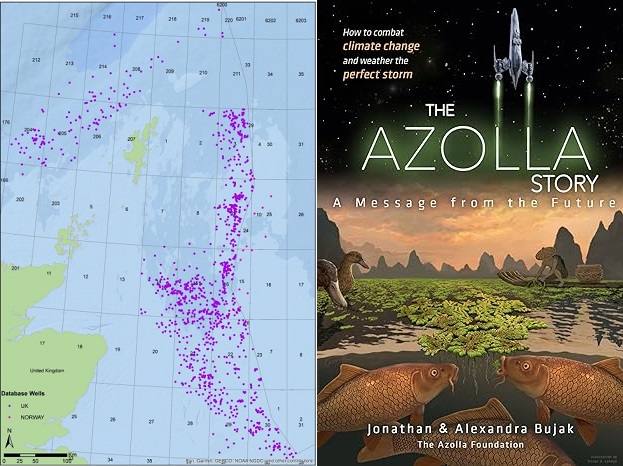
Jonathan set up the non-profit Azolla Foundation in 2012 with his environmental scientist daughter, Alexandra, with whom he published ‘The Azolla Story’ as an e-book and paperback in 2020, available from Amazon. The book has been translated into French, Spanish and Vietnamese where the Azolla Foundation and Minh Pham Gia promote the use of azolla biofertiliser to double the yield of paddy rice.
Jonathan’s non-exclusive well database documents the Paleogene stratigraphy and absolute ages in 1155 offshore UK and Norwegian wells, including the oceanographic and climatic changes described in these articles. Contact Jonathan Bujak or Helen Bone for details: jonathanbujak@outlook.com / helen_bone@merlinenergy.co.uk
References
Amos J. 2019. Arctic wildfires: How bad are they and what caused them? BBC News, 2 August 2019. https://www.bbc.co.uk/news/world-europe-49125391
Arreguín-Rodríguez GJ et al. 2021. Benthic foraminiferal turnover across the Dan-C2 event in the eastern South Atlantic Ocean (ODP Site 1262). Palaeogeography, Palaeoclimatology, Palaeoecology, vol. 572, ISSN 0031-0182, https://doi.org/10.1016/j.palaeo.2021.110410.
Bujak JP. 2023. Paleocene-Eocene high-resolution stratigraphy, paleoceanography and paleoclimate of the North Sea and Faroe-Shetland Basin. Non-exclusive report available from Dr Jonathan Bujak (jonathanbujak@outlook.com)
Bujak JP & Brinkhuis H. 1998. Global warming and dinocyst changes across the Paleocene/Eocene boundary. In: Paleocene/Eocene Boundary Events (Lucas, S.G., Berggren, W. & Aubry, M.-P., eds), Columbia University Press, pp. 277-295.
Coccioni R et al. 2010. The Dan-C2 hyperthermal event at Gubbio (Italy): Global implications, environmental effects, and cause(s). Earth and Planetary Science Letters, vol. 297(1-2), pp. 298-305.
European Commission. 2023. Energy, Climate change, Environment. Methane Emissions. Accessed 29 November 2023. https://energy.ec.europa.eu/topics/oil-gas-and-coal/methane-emissions_en#:~:text=On%20a%20100%2Dyear%20timescale,on%20a%2020%2Dyear%20timescale.
Frieling J et al. 2016. Thermogenic methane release as a cause for the long duration of the PETM. Proceedings of the National Academy of Sciences. Vol. 113(43), pp.12059–12064. doi:10.1073/pnas.1603348113. [accessed 2020 Oct 28]. https://www.pnas.org/content/pnas/113/43/12059.full.pdf.
Gradstein FM et al. 2020. Geologic time scale 2020, 2nd Edition, 1 March 2021. Amsterdam: Elsevier.
Mudge DC & Bujak JP. 2001. Biostratigraphic evidence for evolving palaeoenvironments in the Lower Paleogene of the Faeroe-Shetland Basin. Marine and Petroleum Geology, vol. 18, pp. 577-590.
Pagani M et al. 2011. The Role of Carbon Dioxide During the Onset of Antarctic Glaciation. Science, vol. 334, issue 6060, pp. 1261-1264. DOI: 10.1126/science.1203909
Penn State University. 2023. Ancient Climate Events: Paleocene Eocene Thermal Maximum | EARTH 103: Earth in the Future. wwwe-education.psu.edu. [accessed 2021 Nov 8]. http://www.e-education.psu.edu/earth103/node/639.
Rae JWB et al. 2021. Atmospheric CO2 over the past 66 million years from marine archives. Annu. Rev. Earth Planet. Sci. 49: 599–631. https://doi.org/10.1146/annurev-earth-082420-063026
Rush WD et al. 2023. Assessing Environmental Change Associated with Early Eocene Hyperthermals in the Atlantic Coastal Plain, USA. Clim. Past, 19, 1677–1698, https://doi.org/10.5194/cp-19-1677-2023
Speelman EN et al. 2009. The Eocene Arctic Azolla bloom: environmental conditions, productivity and carbon drawdown. Geobiology. 7(2):155–170. doi:10.1111/j.1472-4669.2009.00195.x
Tierney JE, Zhu J & Li M. 2022. Spatial patterns of climate change across the Paleocene–Eocene Thermal Maximum. Earth, Atmospheric, and Planetary Sciences. 119 (42) e2205326119. https://doi.org/10.1073/pnas.2205326119
Vellekoop J et al. 2014. Earth, Atmospheric and Planetary Sciences, vol. 111 (21) 7537-7541 https://doi.org/10.1073/pnas.1319253111 Rapid short-term cooling following the Chicxulub impact at the Cretaceous–Paleogene boundary.
Voland A. 2016. Methane Matters. NASA earth observatory. March 8, 2016. https://earthobservatory.nasa.gov/features/MethaneMatters
")